Elixir Memory - Not Quite Free
I have been working on a shipping an Elixir service at SalesLoft to replace an existing piece of functionality in our system with a better version. One of the core changes is that the websocket communication of this system will be maintained by Elixir rather than by Pusher (our Rails goto). This post is going to explore some of the surprises and valuable lessons that I gained while debugging memory leaks in the service.
I was doing a usual check-in on the service and noticed that the memory for only ~200 websockets connected was peaking out at over 550MB. This seemed off and meant that connecting all users to the service would take many GB of memory. I was at a loss for what the problem could be though, but found some help in a useful diagnostic tool.
Diagnosing Memory Culprit
When doing local development, it’s very easy to pop open :observer.start and get
a wonderful interface to sift through processes and their memory consumption. However,
exposing this in production is much more difficult (too difficult in my setup to bother).
I found the tool observer_cli and have to
say that it is one of the greatest tools in my toolbox right now. It is based on the
well known recon library, but provides a nice command line interface to visually
see and sort through process listings. I have to give props to the library maintainer
for implementing a feature I requested in a matter of days.
As I was looking at the observer_cli output, I noticed that Phoenix Channel Servers were appearing all over the top memory utilizers. Some would take up to 4MB, but averaged at about 1 MB. For 1000 sockets, this would be between 1GB - 4GB of memory!
Understanding Erlang Memory
One of my favorite posts on Erlang is by Hamidreza Soleimani, Erlang Garbage Collection Details. This post goes over an important detail of how the 2-part Erlang GC works, young and old generational heaps. The gist of it is that the major GC operation can collect both young and old heaps, but is invoked infrequently as it is a “stop the process” type of GC. The minor GC operation can only collect young heap items, and will mark items as old if they survive a GC pass. What does this mean, though?
In the context of a request, it is possible for an operation to take multiple GC minor sweeps and still be referencing all of the allocated binaries (data). When this happens, those binaries are going to be marked as old heap and require that a full sweep happens to GC them. If the full sweep only happens in certain situations, it is possible for the situation to not occur and the full sweep doesn’t occur. In this case, we have a memory leak. This is exactly what was happening to my websocket.
It is possible to trigger a GC on the entire node to test out if there is a possible memory leak. Note that you don’t want to do this in a regular fashion and running the major GC may make your debugging sessions less valuable until time passes.
# don't do this often
Process.list() |> Enum.each(&:erlang.garbage_collect/1)
Addressing this Memory Leak
The websocket request that I’ve been discussing was new and a bit different than what I’ve done in the past. It is an interface to our API and allows requests to be made on the open connection. Due to it being an API request, it would return up to 100 items at a time and require multiple pieces of data sourced from other services to operate. This equates to 2 things: memory (1-4 MB) and time (multiple minor sweeps).
Erlang in Anger 7.2.2 mentions 5 different ways to fix a memory leak:
- call garbage collection manually at given intervals (icky, but somewhat efficient)
- stop using binaries (often not desirable)
- use binary:copy/1-2 if keeping only a small fragment (usually less than 64 bytes) of a larger binary
- move work that involves larger binaries to temporary one-off processes that will die when they’re done (a lesser form of manual GC!)
- or add hibernation calls when appropriate (possibly the cleanest solution for inactive processes)
The above is copied from Erlang in Anger verbatim.
For the work that this websocket request was doing, it made most sense to utilize a short lived process to execute and respond to the request.
The initial pass at the fix involved using Task.async and awaiting the response.
However, this proved to be even worse on memory because sending the response over
the process barrier was causing the same leak. The solution here ended up being to
utilize Phoenix.Channel socket_ref/1
and responding to the socket request in the Task.startd process using Phoenix.Channel.reply(ref, reply).
The socket_ref function is very useful and has some nice side effects. Due to
serialization of processes, the original approach would block access to the socket
during a request. With the new approach, the socket can handle multiple requests
at the same time.
Results from Fix
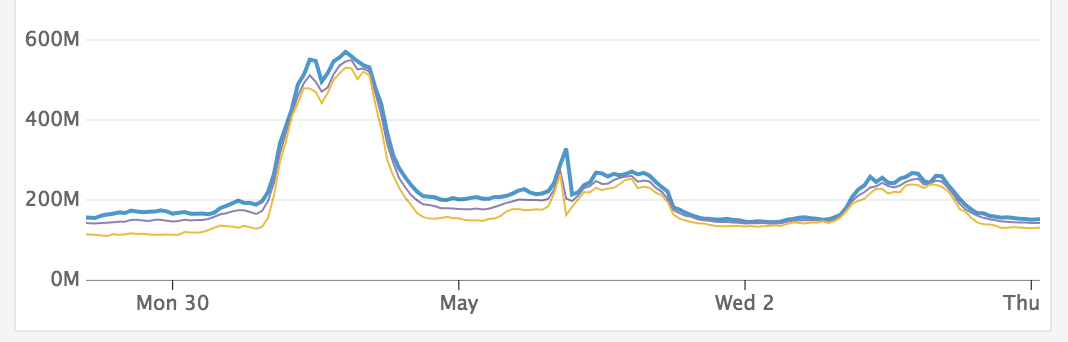
The results from this code change were immediate and apparent. The Phoenix.Channel.Server processes that were from 1MB - 4MB were now at 30KB - 60KB. This lead to the massive drop in overall memory as seen above.
Rinse and Repeat
As more sockets were connected to the system, it became clear there was still a memory
leak. By utilizing the observer_cli tool, it was possible to see that the cowboy
websocket processes were hovering at 1-2MB each. Upon discussion in the community Slack, it turns
out that encoding the large payload suffers from the same type of memory leak that
was mentioned previously. However, the fix is less optimal due to that code not
being written by us.
It appeared that triggering a major GC was the best option.
Phoenix even accommodates this with a special :garbage_collect
message handler, which is marked as a solution for use after processing large messages.
We ended up triggering this 5s after the response of our large payload.
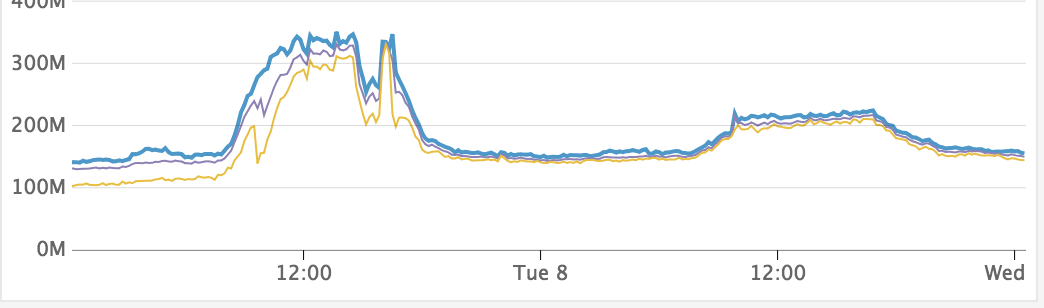
This memory usage is from significantly more connected sockets than step 1, and we can clearly see how large of an impact the manual GC had. The memory is now predictable and stable for connected sockets.
Final Thoughts
This is a very constrained use case, although possibly common, for memory leaks of Phoenix websockets. However, the same principles apply to all of the processes we spawn in Elixir. When we have a process, and especially with a large number of processes, it is important to think about the life cycle of it and how it will play into garbage collection. As our processes become longer lived, this becomes even more important as our systems will be leaking memory over longer periods of time.
It seems easiest to just slap a full system GC into every process to keep memory usage low (and we can do that if desired), but there are other techniques related to process lifecycle and memory consumption that may be more effective in the end.
Again, I recommend reading Erlang in Anger 5, 7 and Erlang Garbage Collection Details for more detailed information.